
Properties of titanium carbide
Titanium carbide is a typical transition metal carbide. Its bond type is composed of ionic bond, covalent bond and metal bond mixed in the same crystal structure, because some titanium carbide has many unique properties. The crystal structure determines that titanium carbide has the basic characteristics of high hardness, high melting point, wear resistance and conductivity. Titanium carbide ceramic is the most widely developed material among the transition metal carbides of titanium, zirconium and chromium. Extensive research has been carried out on titanium carbide powder, bulk and film. Among the composite materials composed of hard dispersed phases of alumina, the effect of alumina-titanium carbide composite ceramics is better. Titanium carbide can inhibit the growth of alumina grains and crack propagation during sintering; Titanium carbide has good wettability with some metals. Titanium carbide ceramics have developed rapidly. Titanium carbide is an important reinforcing agent in metal composite materials. Its products have been widely used in many fields such as machinery, electronics, chemical industry, environmental protection, fusion reactor, national defense industry, etc.
The cheapest way to synthesize titanium carbide powder is to use titanium dioxide and carbon black to promote at high temperature (1700 ℃~2100 ℃) in an inert or reducing atmosphere. However, the titanium carbide synthesized by this method is massive, and it still needs ball milling to make powder after synthesis, and the particle size of the processed powder can only reach micron level. In addition, there are many methods for the synthesis of titanium carbide powder, such as magnesium thermal reduction method, high titanium pool extraction carbonization method, direct carbonization method, high temperature self-propagation synthesis method, reaction ball milling technology preparation method, molten metal bath synthesis method, electric spark erosion method, etc.
As a part of special ceramic materials, titanium carbide and its composites are the key to obtain the ideal structure and predetermined properties by selecting their sintering methods correctly. For example, it is difficult to obtain products with no pores or high strength no matter how the sintering conditions are selected when sintering under normal atmospheric pressure (no special atmosphere, normal pressure). Therefore, titanium carbide ceramics and their composites are usually sintered by hot pressure sintering, hot isostatic pressing sintering, 1 vacuum sintering, self-propagating high temperature sintering, microwave sintering, spark plasma sintering, plasma sintering and other methods instead of normal pressure sintering.
As a worldwide upsurge of microwave sintering ceramic technology in the late 1980s, it can save time and energy, and the heating speed is up to 500 ℃/min, which can make the grains grow up before sintering, thus forming a uniform and fine grain structure, and become one of the sintering technologies that can most realize the ceramic materials with nanocrystalline structure.
As a hot spot in material research, nanomaterials have fundamentally changed the structure of materials, and it is expected to obtain a new generation of materials such as high-strength metals and alloys, plastic ceramics and nanocomposites with special properties. Nanomaterials refer to materials that are composed of extremely fine particles and whose characteristic dimension size is in the order of nanometers (about 100 mm). Due to the extremely fine grains and a large number of atoms in the defect center of the grain boundaries and grains, the performance of nanomaterials is significantly different from that of micron materials of the same composition, which has an important impact on the electrical, thermal, magnetic, optical and other properties of materials. Therefore, the synthesis of nanometer titanium carbide powder is of great significance.
1.2 Basic characteristics of titanium carbide
The basic characteristics of titanium carbide are shown in Table 1-1.
Table 1-1 Basic characteristics of titanium carbide
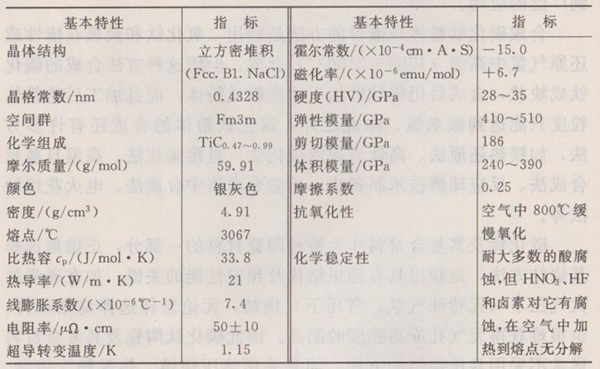
There are three kinds of chemical bonds in this NaC1 structure: metal bond, ionic bond and covalent bond. The metal bond comes from the non-zero density of Fermi energy state and the relatively high electronic density of the region between atoms. The ionic bond is the result of electrostatic force generated by the transfer of charge from Ti atom to C atom. According to calculation, compared with the ideal crystal with neutral atoms, nearly 0.36 electrons migrate from the Ti atom sphere. The fraction of covalent bond is calculated from the decay of the energy level of the octahedral coordination field of the C atom using the linear composition of the molecular orbital. The five 3d orbitals of a Ti atom are split into three t2g symmetric orbitals and two eg symmetric orbitals. For this reason, the convex angle of the eg orbital of Ti extends towards the 2px orbital of adjacent C and forms a Pdo bond, while the t2g orbital of Ti and the Py orbital of adjacent C overlap to form a Pd π bond and the corresponding t2g orbital of adjacent Ti atoms form a ddo bond. It has been confirmed that the following inter-metallic bonds increase with the increase of sub-stoichiometry.
TiC has the same structure as TiN and TiO. O and N can be added as impurities or quantitatively to replace carbon to form binary or ternary solid solutions. These solid solutions are considered to be mixtures of Ti (C, N and O). TiC can also form solid solution with non-carbides of IV and V groups. The phase diagram of C and Ti is shown in Figure 1-1.
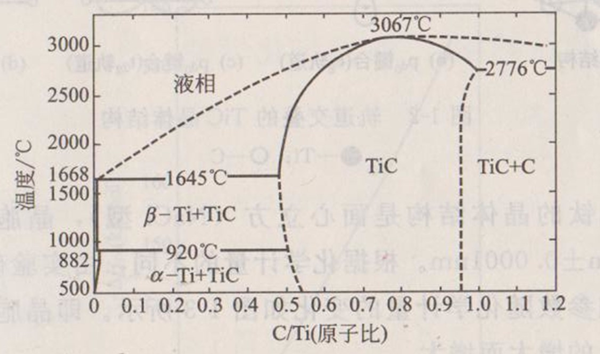
Figure 1-1 Phase diagram of Ti-C
It can be seen from Figure 1-1 that the carbide phase has a particularly wide range. The 2%~3% vacancy formed in the central cubic carbon sublattice of NaC1 structure is the most uniform in the case of TiC1-X, with its mole fraction ranging from 32% to 48.8% and temperature of 1870 ℃. Another carbide Ti2C (mole fraction 33%) was obviously formed near 1900 ℃. At the C-rich angle, TiC0.97 and C form a low eutectic phase at 2276 ℃, which is approximately 63% of C. Many beneficial advances have been made in improving the sintering properties of TiC and the hardness, toughness, strength and wear resistance of TiC materials with metals.
1.3 Structure, physical and thermodynamic properties of titanium carbide
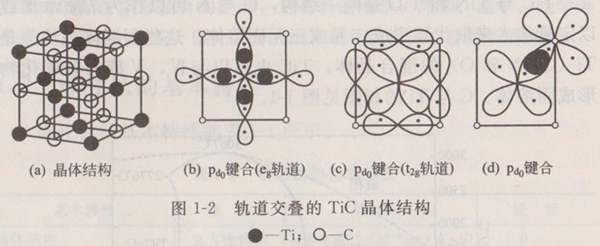
Titanium carbide is a transition metal carbide, which forms a face-centered cubic NaC1 structure by inserting smaller C atoms into the octahedral position of the Ti close-packed lattice, as shown in Figure 1-2. Its spatial group is Fm3m. Its true composition is often non-stoichiometric, expressed by the general formula TiCx, where x refers to the ratio of C to Ti, which ranges from 0.47 to 1.0. The experimental results show that when x=0.45, there are "Ti" and "TiC" phases, and the Ti-C phase diagram is shown in Figure 1-1. Due to the different composition (x), the melting point of titanium carbide is in the range of 1918~3210K, and the composition corresponding to the highest melting point is x ≈ 1.0.
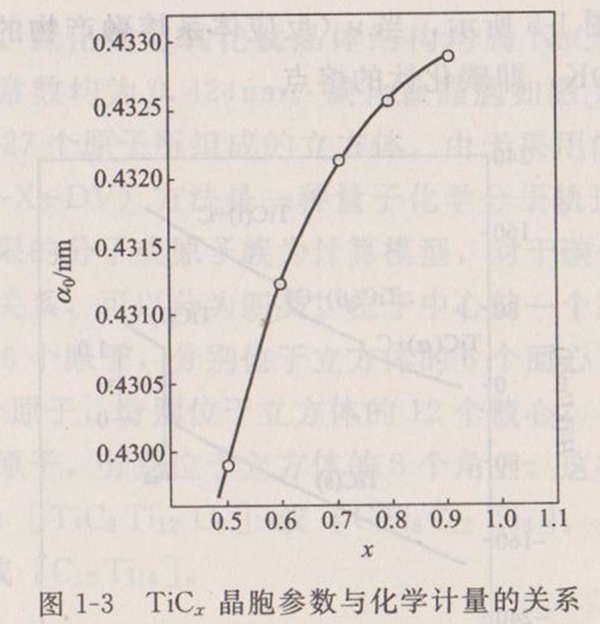
The crystal structure of titanium carbide is face-centered cubic (NaC1 type), and the cell parameter a0=0.4329nm ± 0.0001nm. According to the different stoichiometry, the change of crystal cell parameters of titanium carbide determined by experiments with stoichiometry is shown in Figure 1-3. That is, the cell parameter a0 increases with the increase of the ratio x.
The thermodynamic properties of titanium carbide are shown in Table 1-2.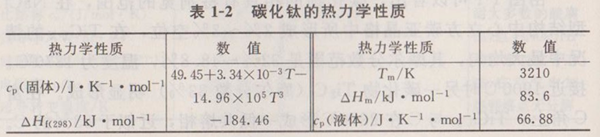
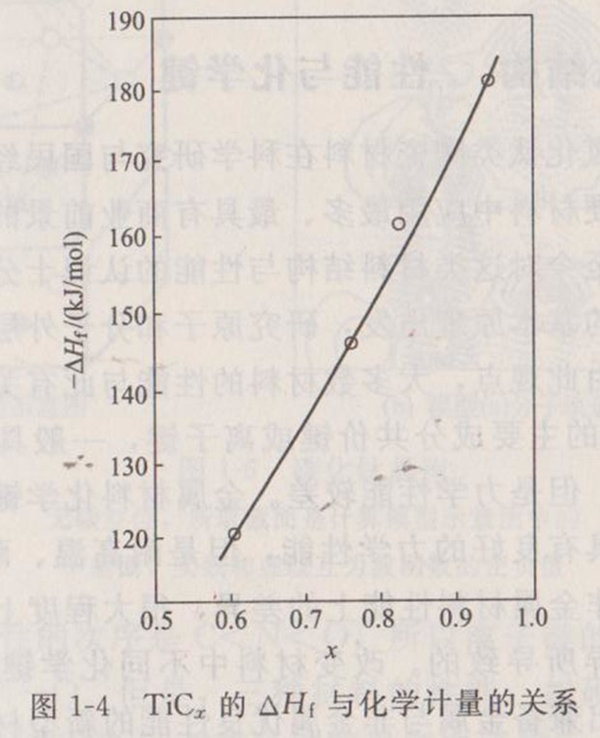
The latest research shows that it is a function of composition, as shown in Figure 1-4. When x=1.0 by extrapolation,=- 194.37kJ • mol-1, which is 5.4% larger than that in Table 1-2.
According to the thermodynamic data in Table 1-2, the adiabatic temperature of titanium carbide can be calculated theoretically, as shown in Figure 1-5. When (fraction of molten products in the reaction system)=0.33,=3210K, that is, the melting point of titanium carbide.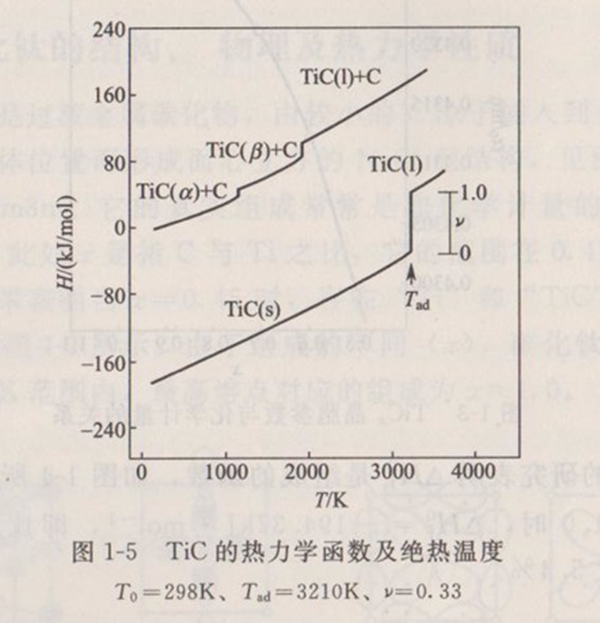
1.4 Structure, properties and chemical bonds of titanium carbide
Titanium carbide and titanium nitride ceramic materials play an important role in scientific research and national economy. At present, titanium carbide and titanium nitride are the most widely used and most promising superhard materials. However, up to now, the understanding of the structure and properties of such materials is very limited. Starting from the basic principles of quantum mechanics, quantum chemistry studies the motion laws and chemical bonds of electrons in the outer layers of atoms and molecules. From some points of view, the properties of most materials are related to this. The covalent bond or ionic bond, the main component of chemical bond of non-metallic materials (ceramics), generally has good high temperature resistance and corrosion resistance, but poor mechanical properties. The main component of chemical bond of metal material is metal bond, which generally has good mechanical properties, but has poor resistance to high temperature and corrosion. Therefore, the difference in properties between metallic and non-metallic materials is largely caused by the difference in chemical bond composition. By changing the proportion of different chemical bond components in the material, it is possible to prepare a new material with excellent properties of both metal and nonmetal.
Comparison of chemical bonds and properties of titanium carbide, titanium nitride and titanium oxide.
The crystal structures of titanium carbide, titanium chloride and titanium oxide all belong to NaC1 face-centered cubic structure, and the lattice constants are 0.424nm. The crystal cell of titanium carbide is shown in the model in Figure 1-6 (a). The middle three layers are a cube composed of 27 atoms. Since the self-consistent field discrete variational Xa (SCF-Xa-DV) method is a quantum chemical molecular orbital calculation method, it usually uses a finite molecular or atomic family as the calculation model. For the position relationship between atoms in titanium carbide crystal cell, it can be divided into four categories: an atom at the center; The six atoms closest to the central atom are located at the six face centers of the cube; The 12 atoms next to the central atom are located at the 12 edge centers of the cube; The eight atoms next to the central atom are located at the eight corners of the cube. In this way, the crystal cell of titanium carbide can be expressed as [TiC6Ti12C8] or [CTi6C12Ti8]. It can also be abbreviated as [Ti13C14] or [C13Ti14].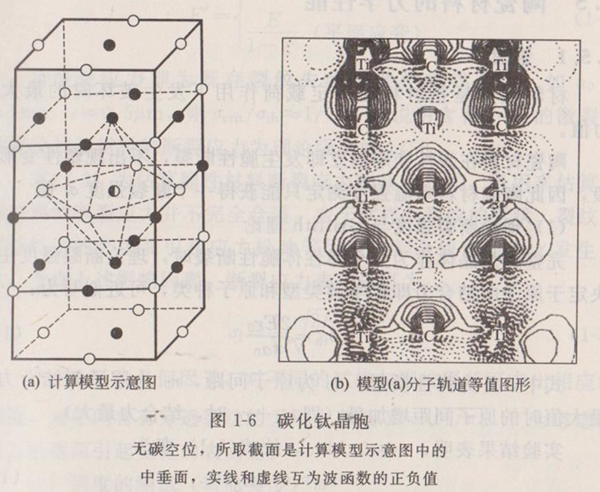
The order of atomic electronegativity is C<N<O, so the strength of ionic bond should be Ti-C<Ti-N<Ti-O. However, the order of properties of the three materials, such as hardness and strength, is TiC>TiN>TiO2, which is opposite to the order of ionic bond strength. Obviously, the differences in the properties of the three materials are not caused by the differences in the ionic bonds between them. In fact, they should belong to covalent crystals. Therefore, the discussion of covalent bonds is more important. The SCF-Xa-DV method is used to calculate the [Ti13C14], [Ti13N14] and [Ti13O14] models. Since the interaction between the central atom and its nearest, next and next neighboring atoms has been considered, the calculation results related to it are mainly considered. The total covalent bond level of each central Ti atom participating in the bonding in the three models [Ti13C14], [Ti13N14] and [Ti13O14] are 1.4620, 1.1305 and 0.8312 respectively. At the same time, in the three models, the covalent bond order of the central Ti atom and the nearest atom, namely, Ti-C, Ti-N or Ti-O bond, is 0.5734, 0.4558 and 0.3497, respectively. It can be seen that the order of covalent bond strength is TiC>TiN>TiO2, which is consistent with the experimental conclusion that the hardness and strength of these three materials decrease in turn.
1.5 Mechanical properties of ceramic materials
1.5.1 Strength
Material strength refers to the maximum stress value when the material is damaged under a certain load.
The brittle fracture of ceramic materials occurs immediately after elastic deformation, and there is no plastic deformation stage. Therefore, only one fracture strength value can be obtained from the strength measurement of ceramic materials at room temperature.
(1) Theoretical fracture strength and Griffith theory
When the complete ideal crystal is brittle fracture as a complete elastic body, the theoretical fracture strength is mainly determined by the binding force between atoms, i.e. the type of chemical bond and the type of atom, which can be approximately written as:
= (1-1)
Where, E is the elastic modulus; Is the atomic spacing, is the increase of atomic spacing when the interatomic binding force is the maximum (i.e., the maximum binding force).
The experimental results show that formula (1-1) becomes:
In fact, the strength of ceramic materials is two orders of magnitude smaller than the theoretical strength. For example, the theoretical fracture strength of alumina is 46 GPa, while the strength of almost flawless alumina whiskers is about 14 GPa, the strength of finely polished alumina single crystal rods is about 7 GPa, and the strength of bulk polycrystalline alumina materials is only 0.1~1 GPa.
Based on the above facts, Griffith believes that the crack of the whole material is caused by the propagation and connection of the existing small cracks in the material. He derived the fracture stress according to the energy criterion. As shown in Figure 1-7, the fracture stress of an infinite plate with a unit thickness of intermediate penetrating cracks when elastic fracture occurs under the action of stress is:
(1-3)
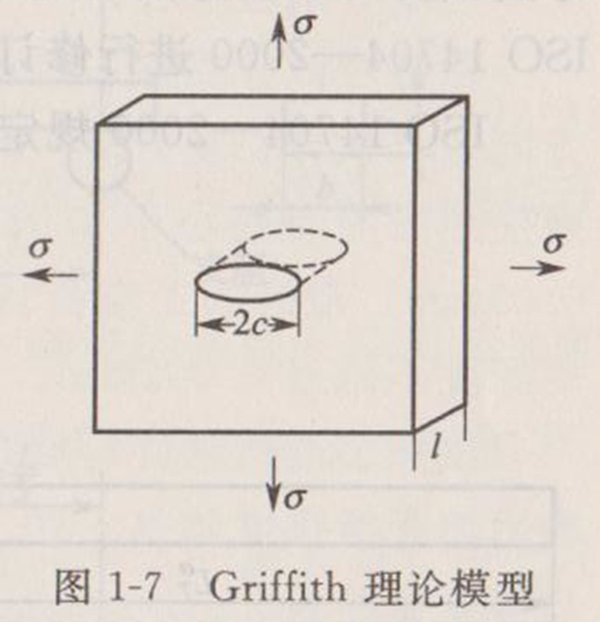
Where, is the surface energy of new surface generated by fracture; C is the half length of the crack; E 'is the elastic modulus.
E’= (1-4)
This fracture stress is the critical stress for the unstable growth of existing cracks. For example, c=0.5, then ≈, which means that the fracture stress of completely brittle material with 1 µ m microcrack is 1/50 of the theoretical strength.
Equation (1-3) is the basic formula for estimating the fracture stress of brittle materials, but it is not completely suitable for estimating the fracture stress of actual materials. Because of the shape of the sample and the crack, the stress relaxation caused by the plastic zone at the crack tip and other factors, the surface energy will change. Considering the above factors, the expression of fracture stress can be:
Where, Y is the geometric factor, and corresponding values can be obtained for different samples and crack shapes, and Y=for infinite thin plates with penetrating cracks in the middle; The change of surface energy caused by stress relaxation is considered.
(1) Strength test (bending strength)
Bending strength is the most common and commonly used strength test of ceramic materials. Bending strength is the maximum stress of a specific elastic beam when it breaks under bending load. The bending strength test method is relatively simple and feasible, and there is comparability between different materials, and the strength of actual product components can be predicted through simple statistical processing of the obtained strength data. For structural ceramics, the test method of flexural strength at ambient temperature is generally the same in various countries. China has developed a standard for the test method of flexural strength of structural ceramics (GB/T 6569-86), which is recently being revised according to ISO 14704-2000.
ISO-14704-200 specifies the dimensions of standard test specimens, as shown in Figure 1-8.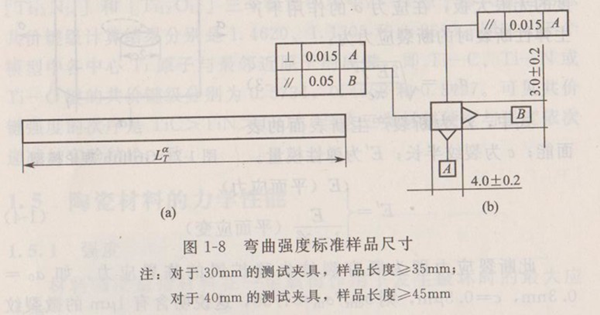
For evaluating the bending strength of the sample, at least 10 samples are required. If statistical strength analysis (such as Weibull statistics) is required, at least 30 samples are required.
The bending strength test is divided into three-point bending and four-point bending. The test structure is shown in Figure 1-9. Four point bending can be divided into 1/4 bending and 1/3 bending.
The bending strength calculation formula of four-point bending is:
The bending strength calculation formula of three-point bending is:
Where, is bending strength, MPa; F is the bending loading pressure, N; A is the length of the bending arm of the specimen (for four-point 1/4 bending, a=L/4;) for four-point 1/3 bending, a=L/3), mm; B is the thickness of the sample, mm; D is the height (thickness) of the sample parallel to the loading direction, mm
The standard specifies the test fixture, in which the rod is used to support and load the sample. It can be made of steel. For samples whose strength can reach 1400MPa, the rod should have a Rockwell hardness of not less than 40; For samples with strength up to 2000MPa, the rod shall have Rockwell hardness of not less than HRC46. At the same time, the fixture can also be made of ceramics with elastic modulus between 200~500GPa and fracture strength greater than 275MPa. The length of the stick shall be greater than 12mm. The diameter of the rod is about 1.5 times the thickness of the sample, and the recommended diameters are 4.5mm and 5.0mm. For the material testing machine used, the chuck displacement speed shall be controllable and can move at a constant speed, and the load indication accuracy shall be better than 1%. Generally, the chuck displacement speed is 05mm/min.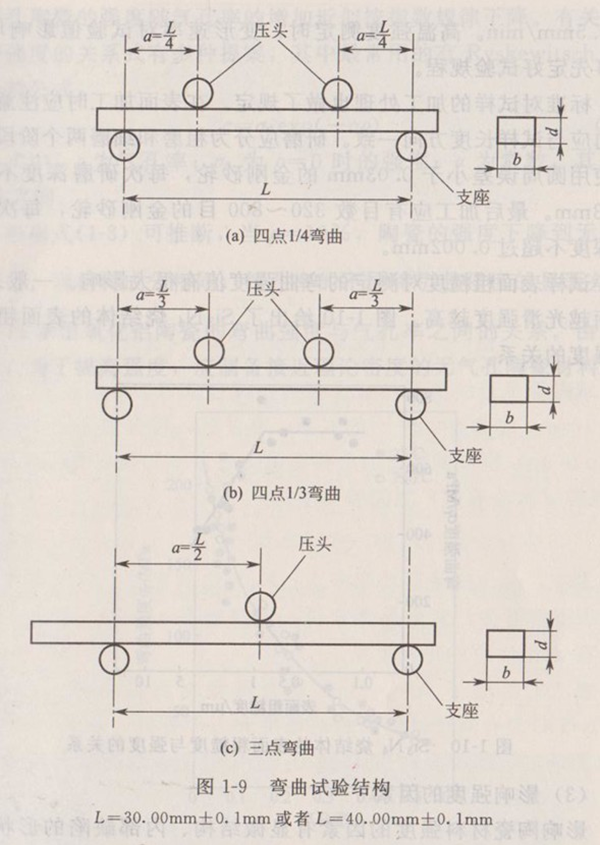
When the high temperature strength is measured, the deformation rate has an increased impact on the test value, and the test procedure should be determined in advance.
The standard also specifies the processing of the sample. During surface processing, the grinding direction shall be consistent with the length direction of the sample. The grinding shall be divided into two stages: rough grinding and fine grinding. The rough grinding shall use diamond grinding wheel with a circumferential error less than 0.03 mm, and the grinding depth shall not exceed 0.03 mm each time. The final machining shall have 320~800 mesh emery wheels, and the depth of each grinding shall not exceed 0.002mm.
The surface roughness of the sample has a great influence on the measured bending strength. Generally speaking, the smoother the surface, the higher the strength. Figure 1-10 shows the relationship between surface roughness and strength of Si3N4 sintered body.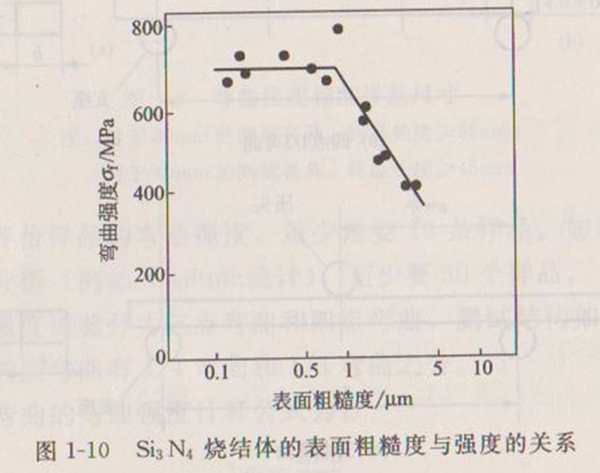
(1) Factors affecting strength
The factors affecting the strength of ceramic materials include microstructure, the shape and size of internal defects, the size and shape of the sample itself and the stress state. Here are some main influencing factors.
1 Effect of microstructure on strength
A. Effect of porosity on strength Porosity is one of the main structural defects of most ceramics. Porosity significantly reduces the cross-sectional area of load action. At the same time, it is also the place that causes stress concentration (for isolated spherical pores, the stress is doubled). It is found that the strength of porous ceramics decreases exponentially with the increase of porosity. There are many proposals for the relationship between porosity and strength, among which the most commonly used is the empirical formula proposed by Ryskewitsch:
Where, is porosity; =0; Is a constant, and its value is between 4 and 7.
According to formula (1-8), it can be inferred that when the strength of the ceramic decreases to no pore. When the material composition is the same, the difference of porosity will cause a significant difference in strength. Figure 1-11 shows the relationship between bending strength and porosity of alumina ceramics. It can be seen from the above that in order to improve the strength, porous ceramic materials with a density close to the theoretical density should be prepared.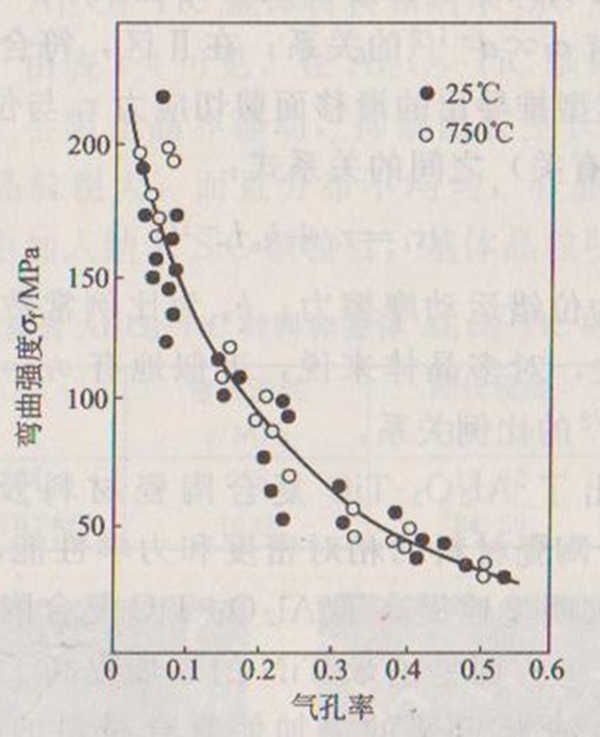
B. Effect of grain size on strength The relationship between the strength of ceramic materials and grain size is shown in Figure 1-12, which conforms to the Hall-Pitch equation:
Where, is the strength of infinite single crystal; Is the coefficient; Is the grain diameter. As shown in Figure 1-12, the relationship curve with d-1/2 is divided into two regions, but both regions are linear. In Zone I, the relationship conforms to Formula (1-5). However, at this time, c ≈ d, so there is a proportional relationship. In zone II, the relationship between the shear stress of slip plane and the length of dislocation pile-up group (related to the size of grain d) derived from the pile-up model of dislocation in metal is consistent:
Where, is the friction force of dislocation motion; Is a proportional constant, which is related to the surface energy at the time of crack formation. For polycrystals, it is approximately. Because, there is a proportional relationship.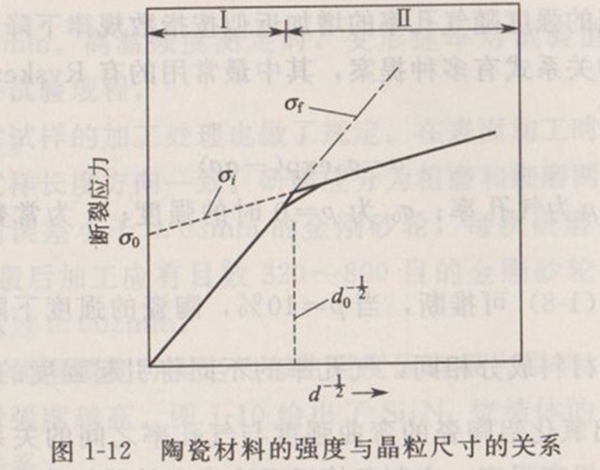
Table 1-3 shows the relative density and mechanical properties of Al2O3-TiC composite ceramic materials and nano-TiN modified Al2O3-TiC composite ceramic materials. It can be seen from Table 1-3 that nano-TiN addition significantly improves the mechanical properties of Al2O3-TiC composite ceramics. On the one hand, the addition of nano-TiN improves the density of the composite; On the other hand, the addition of nano-TiN can refine the grain size of the composite (see Figure 1-13) (hot press sintering, sintering temperature is 1650 ℃, heat preservation is 60 min). The addition of nano-TiN hinders the growth of Al2O3T and TiC grains during sintering. According to Hall-Patch formula, it can be seen that the mechanical properties of the material are significantly improved by refining the grains.
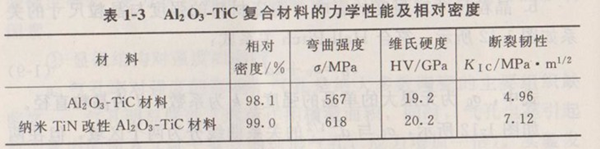
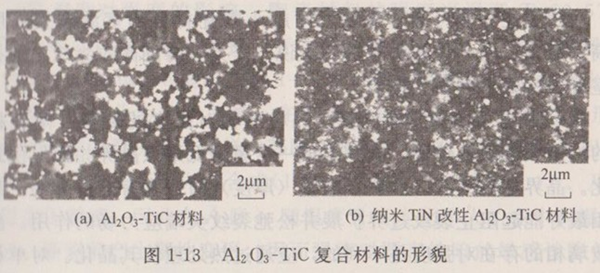
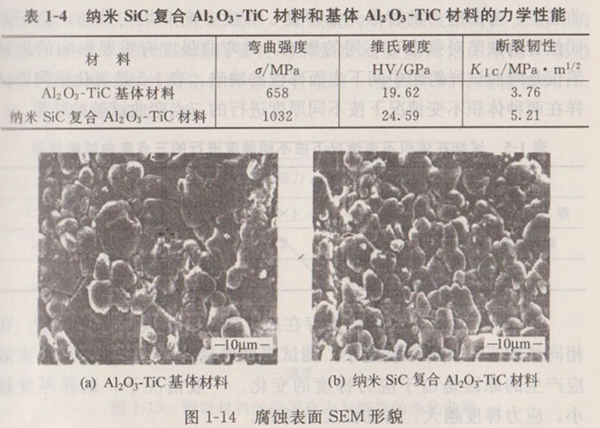
Table 1-4 shows the properties of Al2O3-TiC matrix materials and nano-SiC composite Al2O3-TiC matrix materials. It can be seen from Table 1-4 that the introduction of the second phase nano-SiC into the Al2O3-TiC matrix material will prevent the movement of grain boundaries and inhibit the growth of grains. As shown in Figure 1-14, the grains of the matrix material are coarse and unevenly distributed, with abnormal grain growth. However, when nano-SiC particles are added into the matrix, the matrix grains become smaller.
From the above analysis, the smaller the grain size, the higher the room temperature fracture strength of ceramic materials. Therefore, for structural ceramic materials, efforts to obtain fine grain structure are beneficial and harmless to improve room temperature strength.
C. The effect of the nature and thickness of grain boundary phase and grain shape on the strength of ceramic materials, most of which are sintered with flux, thus forming a certain amount of low melting point grain boundary phase to promote densification. The composition, property and quantity (thickness) of grain boundary phase have a significant impact on the strength. The grain boundary phase is better to prevent the crack from extending beyond the boundary and relax the stress field at the crack tip. The existence of grain boundary glass phase is unfavorable to the strength, and it should be crystallized by overheating. For single-phase polycrystalline ceramic materials, the grain shape is preferably uniform equiaxed grain, so that the deformation is uniform during loading and it is not easy to cause stress concentration, so as to give full play to the strength.
To sum up, the microstructure of high-strength single-phase polycrystalline ceramics should meet the following requirements: small grain size, less crystal defects; The grain size is uniform and equiaxed, which is not easy to cause stress concentration at the grain boundary; The content of grain boundary phase shall be appropriate and the content of brittle glass phase shall be reduced as far as possible, which shall be able to prevent the intragranular crack from extending beyond the boundary and relax the stress concentration at the crack tip; Reduce the porosity to make it close to the theoretical density.
② The effect of specimen size on strength the strength index of structural ceramic materials is usually bending strength. The bending stress is characterized by non-uniform distribution along the thickness and length, and the defects at different positions have different effects on the strength. The micro-defects that have an important impact on the bending strength are only the defects on the middle and lower surface of the bending specimen span. Table 1-5 shows the results of three-point bending test of alumina ceramic samples with different thickness under two conditions of constant volume.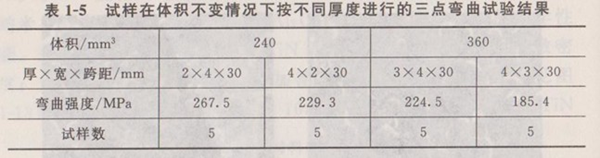
It can be seen from Table 1-5 that the bending strength has size effect, especially thickness effect. Under the same volume, the smaller the sample thickness, the higher the test strength value. The thickness effect of bending strength is due to the change of stress gradient. In general, the smaller the sample thickness, the greater the stress gradient and the higher the bending strength.
③ The effect of temperature on strength The strength of ceramic materials basically remains unchanged when the temperature is (), and decreases significantly when the temperature is higher than. Brown et al. proposed the fracture stress change curve of ceramics as shown in Figure 1-15. The whole curve is divided into three regions. In low temperature zone A, there is no plastic deformation before fracture. The fracture of ceramics is mainly determined by the crack propagation caused by the existing defects (cracks, pores, etc.) in the sample. The fracture stress conforms to formula (1-5). However, E ',, and c in the formula are not sensitive to temperature, so there is little change with temperature rise in Zone A. In the middle temperature zone B, plastic deformation occurs before fracture, so the sensitivity of strength to existing defects is reduced. Fracture is controlled by plastic deformation, which decreases significantly with the increase of temperature. When the covalent and ionic bond crystals produce plastic deformation due to dislocation movement, the deformation stress is very sensitive to the change of temperature. At this time, the fracture stress is controlled by the pile-up mechanism, and the relationship between the fracture stress and the grain diameter conforms to formula (1-9).
When the temperature rises further (zone C), the two-dimensional slip surface continues to slip, relaxing the stress concentration, and thus resisting the crack initiation. Because the cross slip of dislocations becomes active with the increase of temperature, the relaxation effect on the stress at the front of dislocation pile-up group is more obvious. Therefore, in this region, the fracture stress tends to increase with the increase of temperature. Figure 1-15 shows the general trend of the relationship between the strength of ceramic materials and temperature, which is not very good for all ceramic materials, and not all ceramic materials A, B and C appear.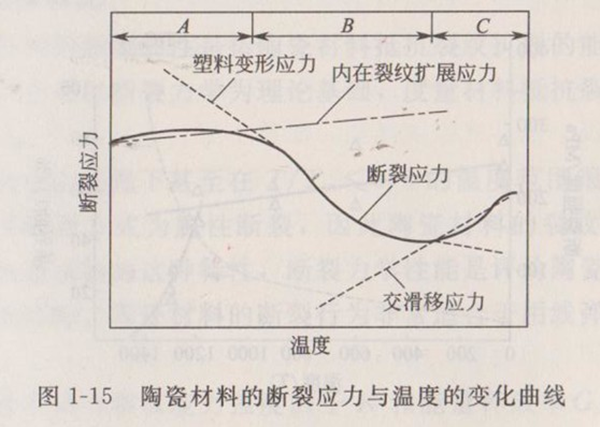
For example, the change of bending strength of TiC with temperature is shown in Fig. 1-16. In general,
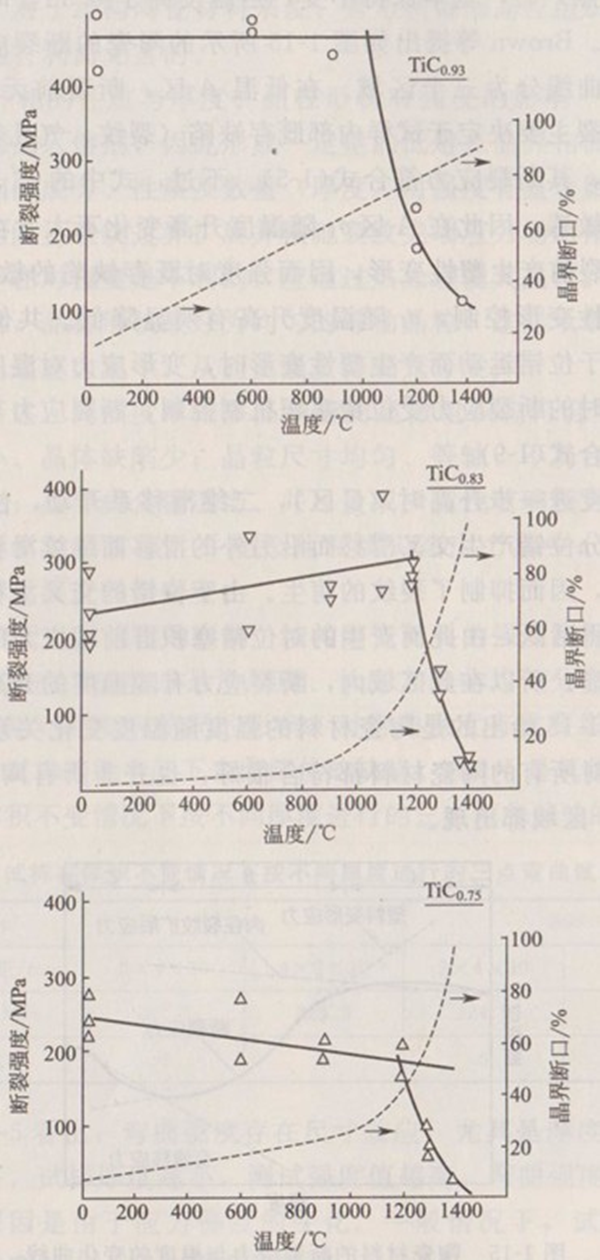
The strength remained unchanged until 1200 ℃. However, with the difference of X in, the temperature point corresponding to the sudden change of strength is also different. This sudden change of strength is caused by the softening or melting of impurities on the grain boundary. The reduction of strength goes from the initial transgranular fracture at low temperature to the dominant transgranular fracture at high temperature, as shown in the dotted line in Fig. 1-16. The temperature point of strength change corresponds to the composition of impurities in the grain boundary.
Figure 1-17 shows the curve of strength of some ceramic materials with temperature. From these curves, we can find the difference of bending strength of various ceramic materials at high temperature, which can be used as the basis for determining the maximum service temperature of corresponding ceramic materials.
1.5.2 Fracture toughness
The fracture toughness of ceramic materials refers to the ability of ceramic materials to resist crack propagation, also known as fracture toughness. Based on fracture mechanics, it is an index to measure the ability of material to resist crack propagation.
It is difficult for ceramic materials to produce plastic deformation at room temperature or even in the temperature range of, and its fracture mode is brittle fracture, so the crack sensitivity of ceramic materials is very strong. Based on this characteristic of ceramic materials, fracture mechanical properties are an important index to evaluate the mechanical properties of ceramic materials. The fracture behavior of ceramic materials is very suitable to be described by linear elastic fracture mechanics.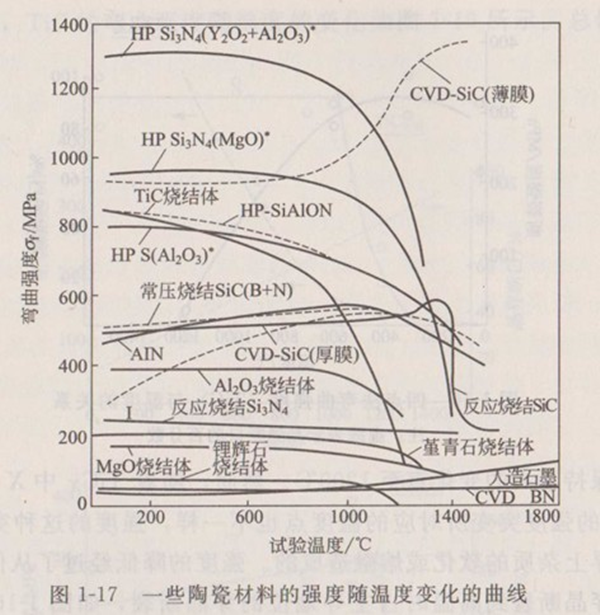
Linear elastic fracture mechanics takes the stress intensity factor K and energy release rate G as the parameters to control crack growth. At present, stress intensity factor K is mostly used. It is a parameter describing the stress-strain field of the crack tip attachment, and has the following relationship with the applied stress and crack size:
Where, is a numerical constant, which is related to the loading mode, specimen and crack geometry. When a certain critical value is reached, the crack will grow unsteadily, leading to fracture. It is used to express fracture toughness, unit:. The crack propagation of ceramic materials mainly belongs to the open crack model, which is referred to as type I (type II is crack stagger type, type III is crack tear type), so the fracture toughness of ceramic materials is generally expressed in.
As a measure of resistance to crack propagation, fracture toughness is an important performance index to ensure the safety of materials with cracks or defects.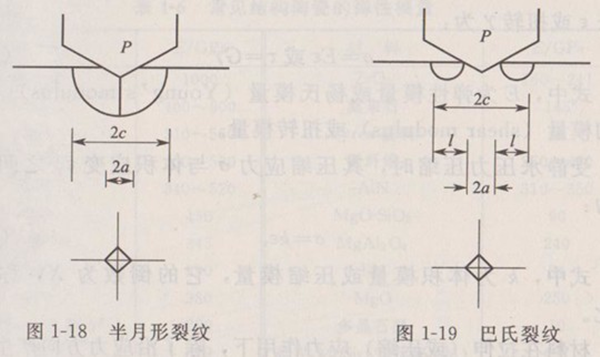
Determination of fracture toughness by indentation method (IM): It is a method obtained from the crack length, E and Vickers hardness H value generated by indentation and four corners while Vickers hardness is measured. Figure 1-18 and Figure 1-19 show the two crack forms given by the indentation side section. The first is a half-moon crack, and the second is a Babbitt crack. For different types of cracks, the calculation formula is different. Even for the same type of crack, there are several different calculation equation proposals. Here only the calculation formula given by Niiha-ra is given.
For half-moon cracks:
() (1-12)
For Babbitt crack:
() (1-13)
The biggest advantage of this method is that it can be tested with a small sample, that is, the value can be obtained while measuring Vickers hardness; However, the measured values will produce certain errors with the different properties of the material, especially when there is phase transformation toughening effect in the material.
1.5.3 Elastic modulus
In the elastic deformation range of ceramic materials, the ratio of stress to strain is called the elastic modulus of the material.
Ceramic materials are brittle materials, which can hardly produce plastic deformation when loaded at room temperature, and fracture occurs within the elastic deformation range. Therefore, its elastic properties are particularly important. Like other solid materials, the elastic deformation of ceramic materials can be described by Hooke's Law. If the tensile stress is or the shear stress is, the elongation or torsion is:
(1-14)
Where, is the elastic modulus or Young's modulus; G is shear modulus or torsion modulus.
When compressed by hydrostatic pressure, the relationship between compressive stress and volumetric strain is:
(1-15)
Where, is the bulk modulus or compression modulus, and its reciprocal is X, which is called the compression ratio.
Under the action of tensile (or compression) stress, the material will not only elongate (or shorten) along the stress direction, but also shorten (or lengthen) perpendicular to the stress direction. The negative value of the ratio of the strain in the vertical direction to the strain in the stress direction is called Poisson's ratio, which is usually expressed by.
The above four elastic constants are the property constants of materials, with the following relationship:
(1-16)
The elastic deformation of a material is actually the result of a small displacement of the atomic spacing at the equilibrium position under the action of an external force. Therefore, the external force required for the elastic deformation is related to the interatomic binding force and binding energy, that is, the important factor affecting the elastic modulus is the interatomic binding force, that is, the chemical bond. Table 1-6 shows the elastic modulus values of common structural ceramics. It can be seen from the data in Table 1-6 that diamond has the highest elastic modulus, which also shows that the bonding bond (covalent bond) of diamond is the strongest of all materials; The second is carbide ceramics (mainly covalent bonds), the second is oxide ceramics, and the relatively weak is oxide ceramics (mainly ionic bonds).
(1) Effect of temperature on elastic modulus
The elastic modulus reflects the magnitude of the external force required by the small change in atomic spacing. The gravitational and repulsive forces of two atoms in a solid can be described by the famous Condon Moase curve (Fig. 1-20). The average distance between two atoms is the external force required to leave or approach, that is, the slope of the curve at.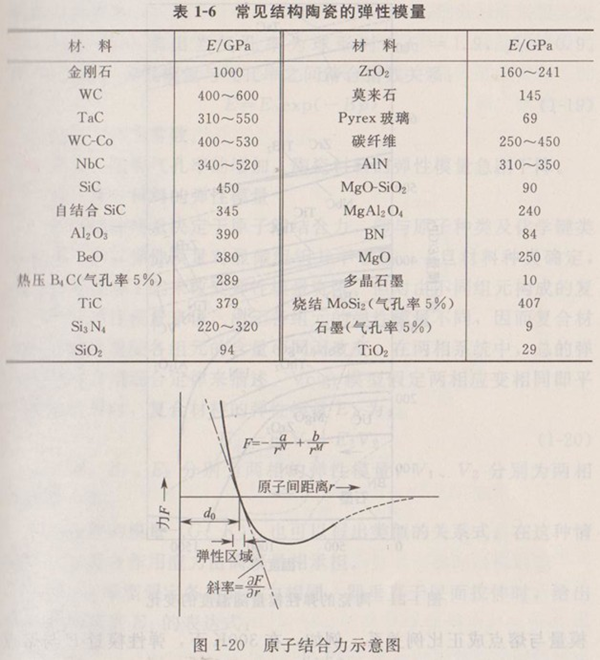
Because the atomic spacing and binding force change with temperature, the elastic modulus is very sensitive to temperature. When the temperature increases, the atomic spacing increases, and the slope of the curve in Fig. 1-20 slows down, that is, the elastic modulus decreases. Therefore, the elastic modulus of solids generally decreases with the increase of temperature. Figure 1-21 shows the change of elastic modulus of some ceramic materials with temperature. Generally speaking, materials with small linear expansion coefficient often have high elastic modulus.
(1) Relationship between elastic modulus and melting point
The melting point of a material reflects the size of its interatomic binding force. Generally speaking, the elastic modulus is in direct proportion to the melting point. For example, at 300K, the relationship between elastic modulus E and melting point is as follows:
(1-17)
Where, is the atomic volume or molecular volume.
(2) Relationship between elastic modulus and material density
The compactness of ceramic materials has a great influence on its elastic modulus. The relationship between the elastic modulus E and the porosity satisfies the formula (1-18):
(1-18)
Where is the elastic modulus when the porosity is 0; And constant determined by pore shape.
Mackenzie calculated that when the porosity is spherical,=1.9,=0.9. Frost pointed out that the relationship between elastic modulus and porosity is exponential:
(1-19)
Where, B is a constant.
In short, with the increase of porosity, the elastic modulus of ceramic materials decreases sharply.
(3) Elastic modulus of composite materials
Because the elastic modulus is determined by the binding force between atoms, that is, it is related to the type of atoms and chemical bonds, so the elastic modulus is not sensitive to the microstructure. Once the material type is determined, it is limited to change the elastic modulus through heat treatment and other processes. However, for the elastic modulus of composites composed of different components, because the elastic modulus of each component is different, the elastic modulus of the composite changes with the content of each component. In a two-phase system, the total elastic modulus can be described by the mixing law. Voigt model assumes that the elastic modulus of the composite is:
(1-20)
Are the elastic moduli of the two phases; Is the volume fraction of the two phases.
For other moduli (G, K), a similar relationship can also be written. In this case, most of the acting stress is borne by the high modulus phase.
Reuss model assumes that the stress of each phase is the same, that is, when the tension is perpendicular to the layer, the expression of composite modulus is given:
(1-21)
Similar relationships can be written for other moduli. Conforming to and representing the upper and lower limit values of elastic modulus of composite materials respectively. Hashin and Shtrikman have also determined the upper and lower limits of the modulus of two-phase composites, which are much narrower than the range between the two limits, and do not include any special assumptions about the geometric shape of the phase. Figure 1-22 shows the calculated values of Voigt and Reuss expressions and the upper and lower limits of Hashin and Shtrikman, as well as the comparison with the WC-Co system test data. The data in the figure are normalized, and it can be seen from the figure that the Hashin-ShtriKman limit is more consistent with the test data than the Voigt and Reuss expressions. In fact, the elastic modulus of composite materials cannot be accurately described by the mixing law. The reason is that the assumption of equal stress and equal strain is not completely reasonable. The actual composite material is in the state between the two, so the test data falls between these two limits.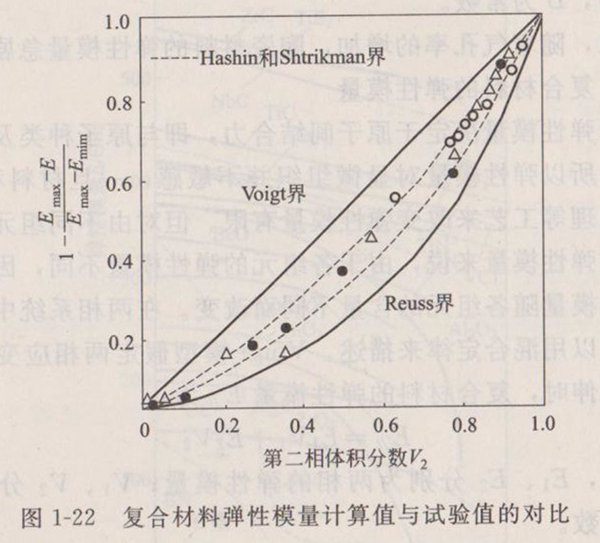
(1) Test method for elastic modulus
There are many methods to measure the elastic modulus of solid materials. According to the definition of elastic modulus, direct testing of the ratio of stress and strain is called direct method. This method can be realized by means of load-deflection curve or sticking strain gauge. In addition, some indirect methods can be established according to the relationship between the elastic modulus of the material and the transmission of vibration frequency or wave velocity. The direct method is mostly adopted in China, while the indirect method is mostly adopted internationally. Our national standard (GB 10700-89) adopts two methods, namely bending method (direct) and acoustic resonance method (indirect), for the choice of elastic modulus test. Among the standards currently being revised, the resonance method is equivalent to the international standard ISO 17561.
The acoustic resonance method uses continuously variable frequency waves to excite rectangular prismatic or cylindrical samples and measure the bending or twisting frequency of the samples. The mechanical excitation acting on the sample is realized by the converter, which converts the circulating current signal into the circulating mechanical force. The other converter measures the mechanical vibration frequency of the sample and converts it into an electrical signal. Detect frequency and amplitude through oscilloscope or other equipment to find resonance frequency. The maximum response is the resonance frequency. The dynamic elastic modulus is calculated from the detected fundamental frequency, sample size and sample mass. The elastic modulus depends on the bending response frequency, and the shear modulus depends on the torsion response frequency.
Figure 1-23 shows the hanging test device.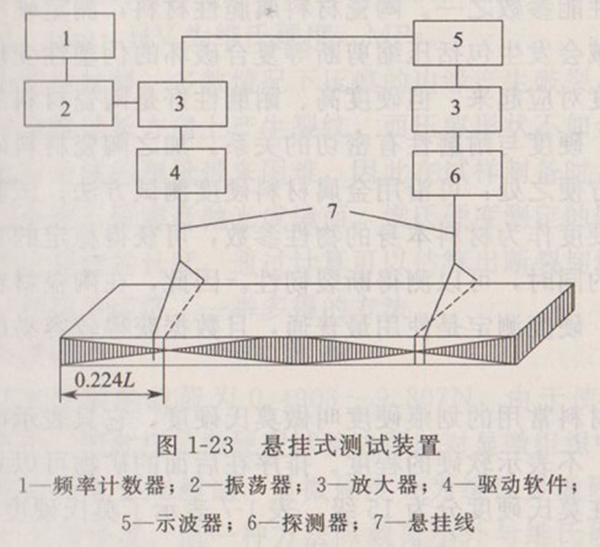
The sample shall be a regular rectangular prism or round bar. The rod-shaped specimen with circular cross-section is only suitable for bending response test. The length () of the sample shall be greater than 40mm, and the ratio of length to thickness (), or the ratio of length to diameter () shall be greater than 20. For torsion response, the ratio of width (b) to thickness (t) shall be 5. The parallelism of the specimen in the direction of length and thickness shall be less than 0.1%, and less than 0.5% in the direction of thickness. The surface of the sample shall be smooth and flat, and the edges shall not be chamfered. The mass of the sample shall not be less than 5g.
The dynamic elastic modulus of rectangular prism specimen is calculated according to formula (1-22).
× (1-22)
Where, E is the dynamic elastic modulus, GPa; Is the mass of the sample, kg; Is the basic bending response frequency, Hz; B is the sample width, m; L is the length of the sample, m; T is the sample thickness, m.
The dynamic elastic modulus of the round section bar specimen is calculated according to formula (1-23).
(1-23)
1.5.4 Hardness
Hardness is the ability of a material to resist scratching or pressing into its surface by other objects, and is one of the important mechanical properties parameters of a material. Ceramic materials are brittle materials. When measuring the hardness, pseudo-plastic deformation including composite failure such as compression and shearing will occur in the indenter pressing area, and its hardness is difficult to correspond with the strength. However, high hardness and good wear resistance are one of the main excellent characteristics of ceramic materials. Hardness is closely related to wear resistance. In addition, the hardness measurement of ceramic materials has the following advantages: the hardness test method of metal materials can be used; The test method and equipment are simple; As a physical parameter of the material itself, hardness can obtain a stable value; When Vickers hardness is measured, fracture toughness can be measured. Therefore, in the evaluation of mechanical properties of ceramic materials, hardness measurement is one of the most common evaluation methods, and the data is easy to obtain.
The commonly used scratch hardness of mineral materials is called Mohs hardness, which only indicates the order of hardness from small to large, not the degree of hardness. The minerals in the rear can cut the minerals in front. Now Mohs hardness is divided into 15 grades. Table 1-7 shows the Mohs hardness grading sequence.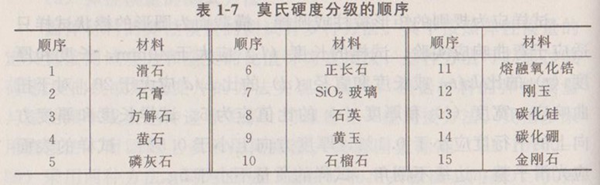
At present, the main method used to determine the hardness of ceramic materials is the diamond indenter loading indentation method, including Vickers hardness, Micro hardness and Rockwell hardness.
(1) Vickers hardness
The Vickers hardness test is to use a diamond pyramid with a 136 ° opposite angle as the indenter, press it into the ceramic surface under the load of 9.807~490.3N, hold for 10~20s, and remove the load, leaving an indentation on the material surface. Measure the length of the diagonal under the microscope and calculate the surface area of the indentation, and calculate the load-stress on the unit area, which is the Vickers hardness value HV.
HV= (1-24)
Where, P is the load, N; S is the surface area of indentation, mm2; D is the average length of indentation diagonal, mm; HV is Vickers hardness, MPa.
Ceramic is a brittle material. In most cases, the edge of the indentation is cracked, and cracks are produced along the diagonal extension direction on the indentation angle. The shape of the indentation is not as regular as that of metal materials, which makes it difficult to measure the diagonal. Therefore, when preparing the sample, the test surface is finally polished into a mirror with diamond abrasive paste. At the same time of Vickers hardness measurement, the fracture toughness can be estimated by calculation according to the length of cracks at the corner of the indentation. Vickers hardness test is a simple and economical method.
(2) Microhardness
The load used for microhardness is 0.4903~9.807N, and the indentation size is also small due to the small load. Therefore, the microhardness test method can be used to test the hardness of different phases or different grains in the microstructure. The microhardness is divided into Vickers microhardness and F. Knoop microhardness. The former method is basically the same as Vickers hardness except for small load (including indenter shape, indentation measurement, hardness value calculation formula, etc.). Here, only Knoop microhardness is introduced. The indentation of Knoop microhardness (hereinafter referred to as Knoop hardness) is rhombic, and the angle of diamond indenter is 172 ° 30 'and 136 ° respectively. The Knoop hardness value HK can be calculated from the diagonal length d of the indentation and the load P by equation (1-25):
HK== (1-25)
Where, HK is the hardness value, MPa; P is the load, N; A is the projected area of indentation, mm2; D is the long diagonal length of the indentation, mm; C is the head constant.
C=cot (1-26)
Within the load range used for microhardness, when measuring high hardness with small load, the hardness value depends on the load to a certain extent. Therefore, the large load should be used as far as possible. In addition, Knoop hardness is more dependent on the load than Vickers hardness. No matter which method is used, it is better to indicate the load value.
(3) Rockwell hardness
The Rockwell hardness test method is to first add the reference load, then add the test load, and then return to the reference load to measure the indenter penetration depth difference under the secondary load